EvoTrack
Equipment Analysis Solution
Monitor your machinery's status and detect potential issues early to enable preventive maintenance. This strategy maximizes equipment uptime, minimizes unnecessary downtime, and improves overall operational efficiency.
Get a Quote
Use Cases
Track and Optimize Every Equipment
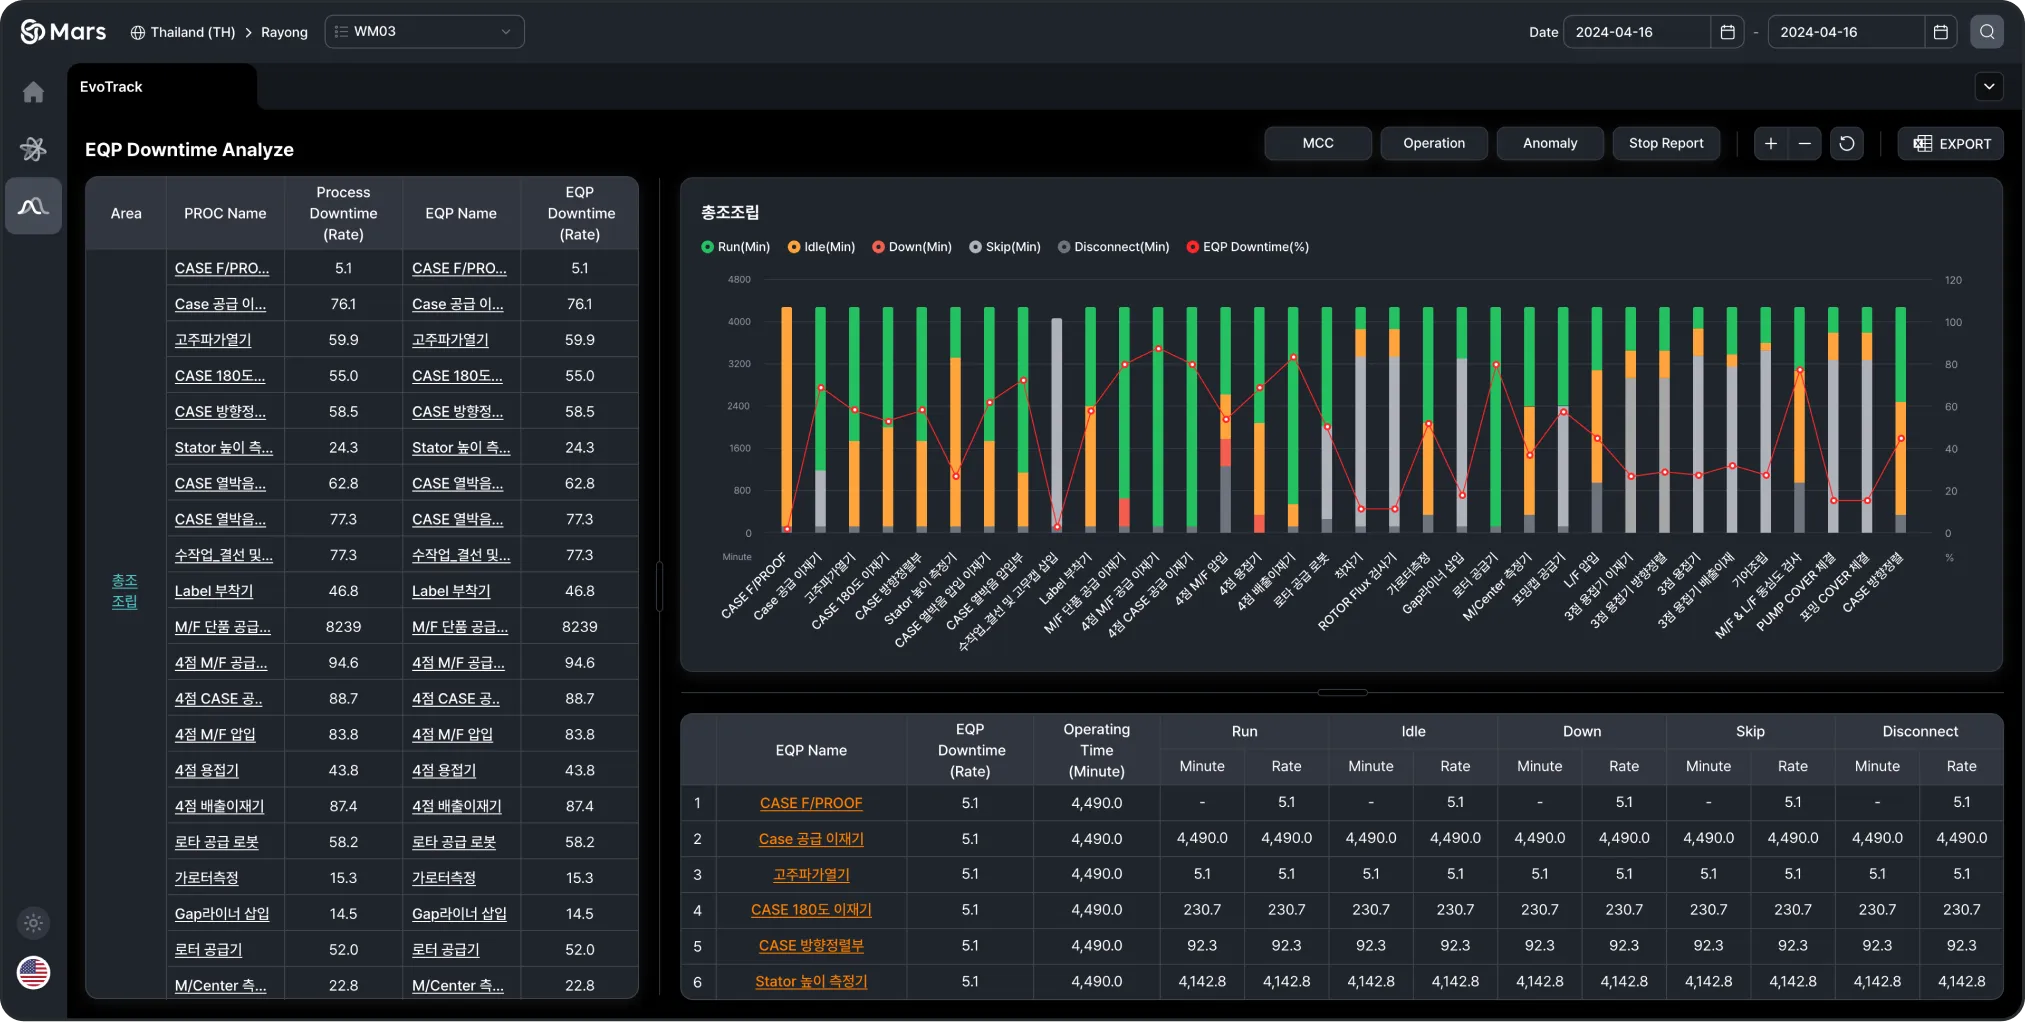
Overall Equipment Downtime Graph
It analyzes and displays the operational and non-operational states of each piece of equipment over a specific period, helping to efficiently monitor the status of the equipment.
Equipment List
Shows equipment names and operational rates (%), categorized by states like Idle, Down, Skip, and Disconnect.
Downtime Analysis Graph
Visualizes equipment states (Run, Idle, Down) with bar and line charts, making it easy to compare operational performance.
Detailed Data
Provides a table with metrics for each equipment’s operational and downtime status, helping identify areas for improvement.
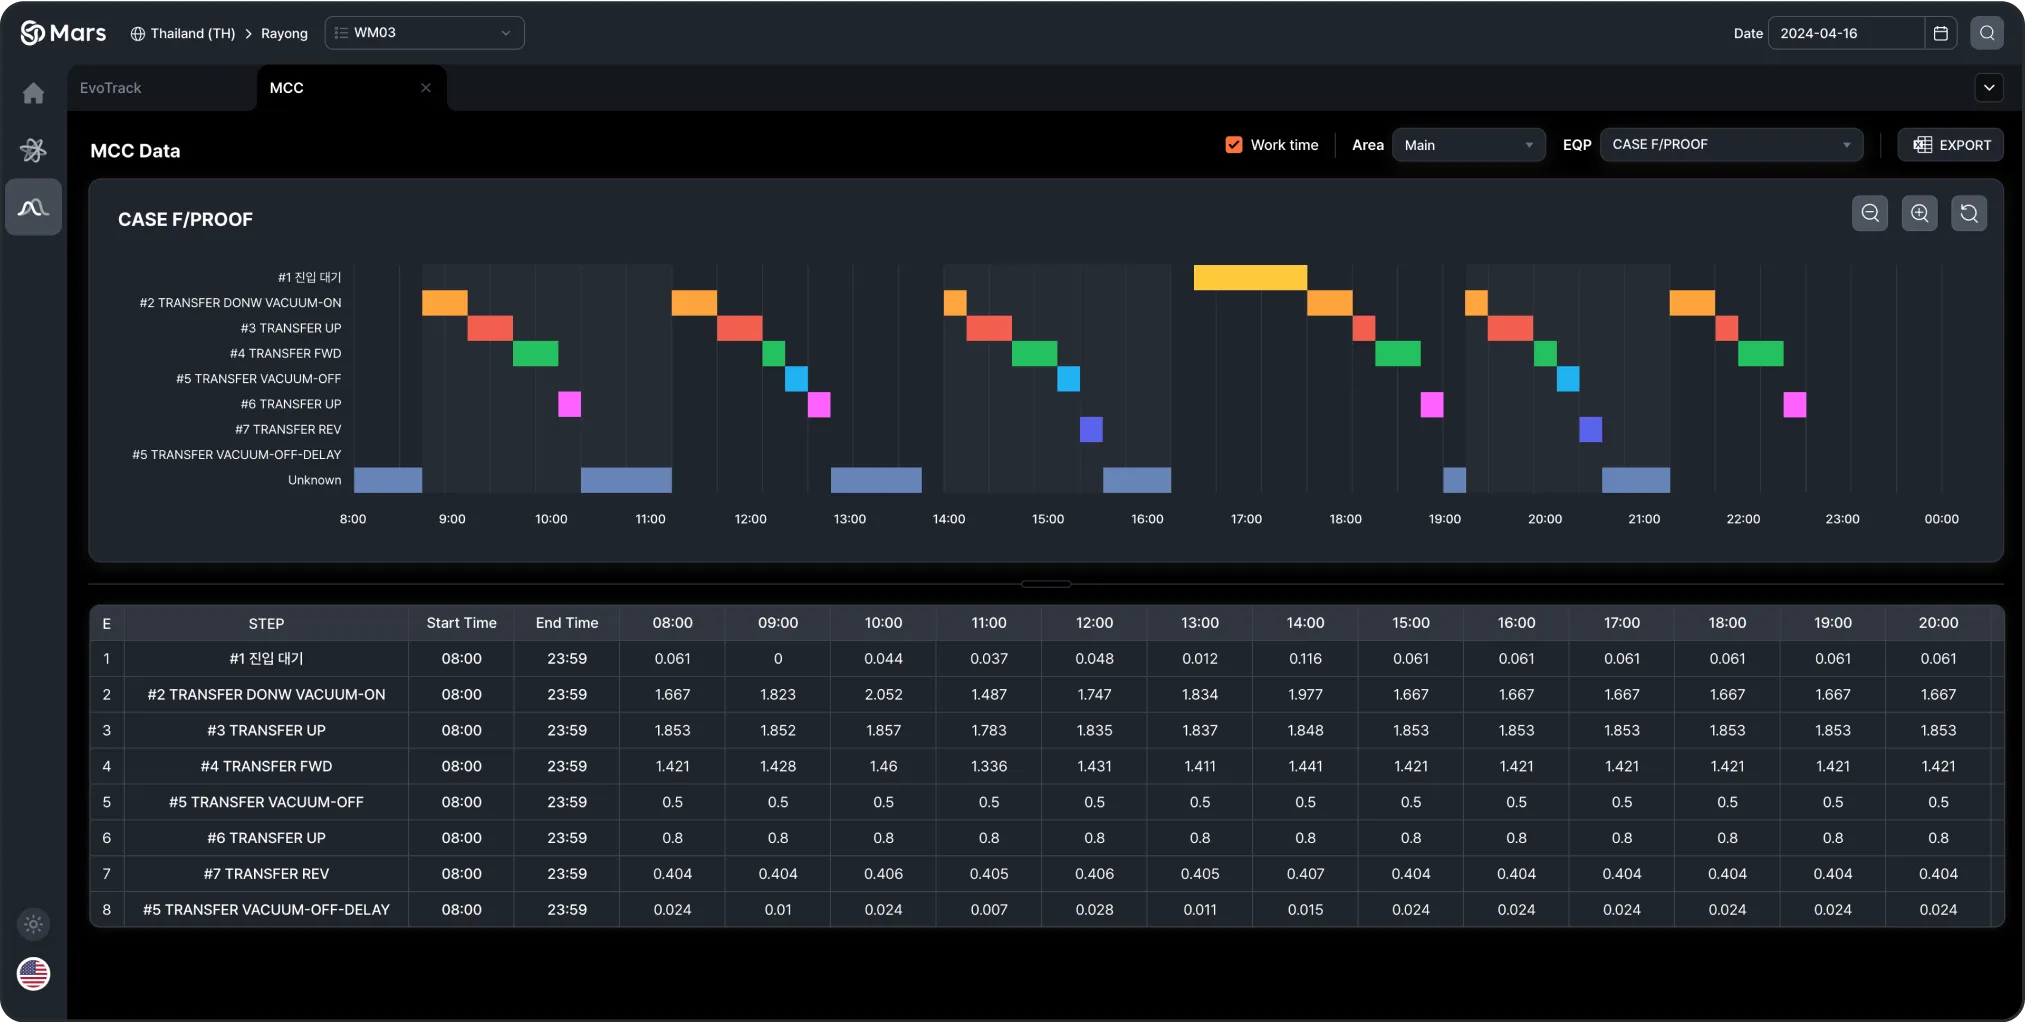
Equipment Operation (Cycle Step) Analysis
It displays the operation of each equipment cycle step across different time periods in both graphical and table formats, providing a clear view of the workflow and time spent on each cycle step.
Cycle Step Graph
Each equipment cycle step is visually represented with different colors, showing when each step was performed over specific time intervals.
Table Data
Provides the start and end times for each cycle step, along with the time spent in each time period, allowing for an analysis of the efficiency and duration of each step. Inefficiencies can be easily identified through this data.
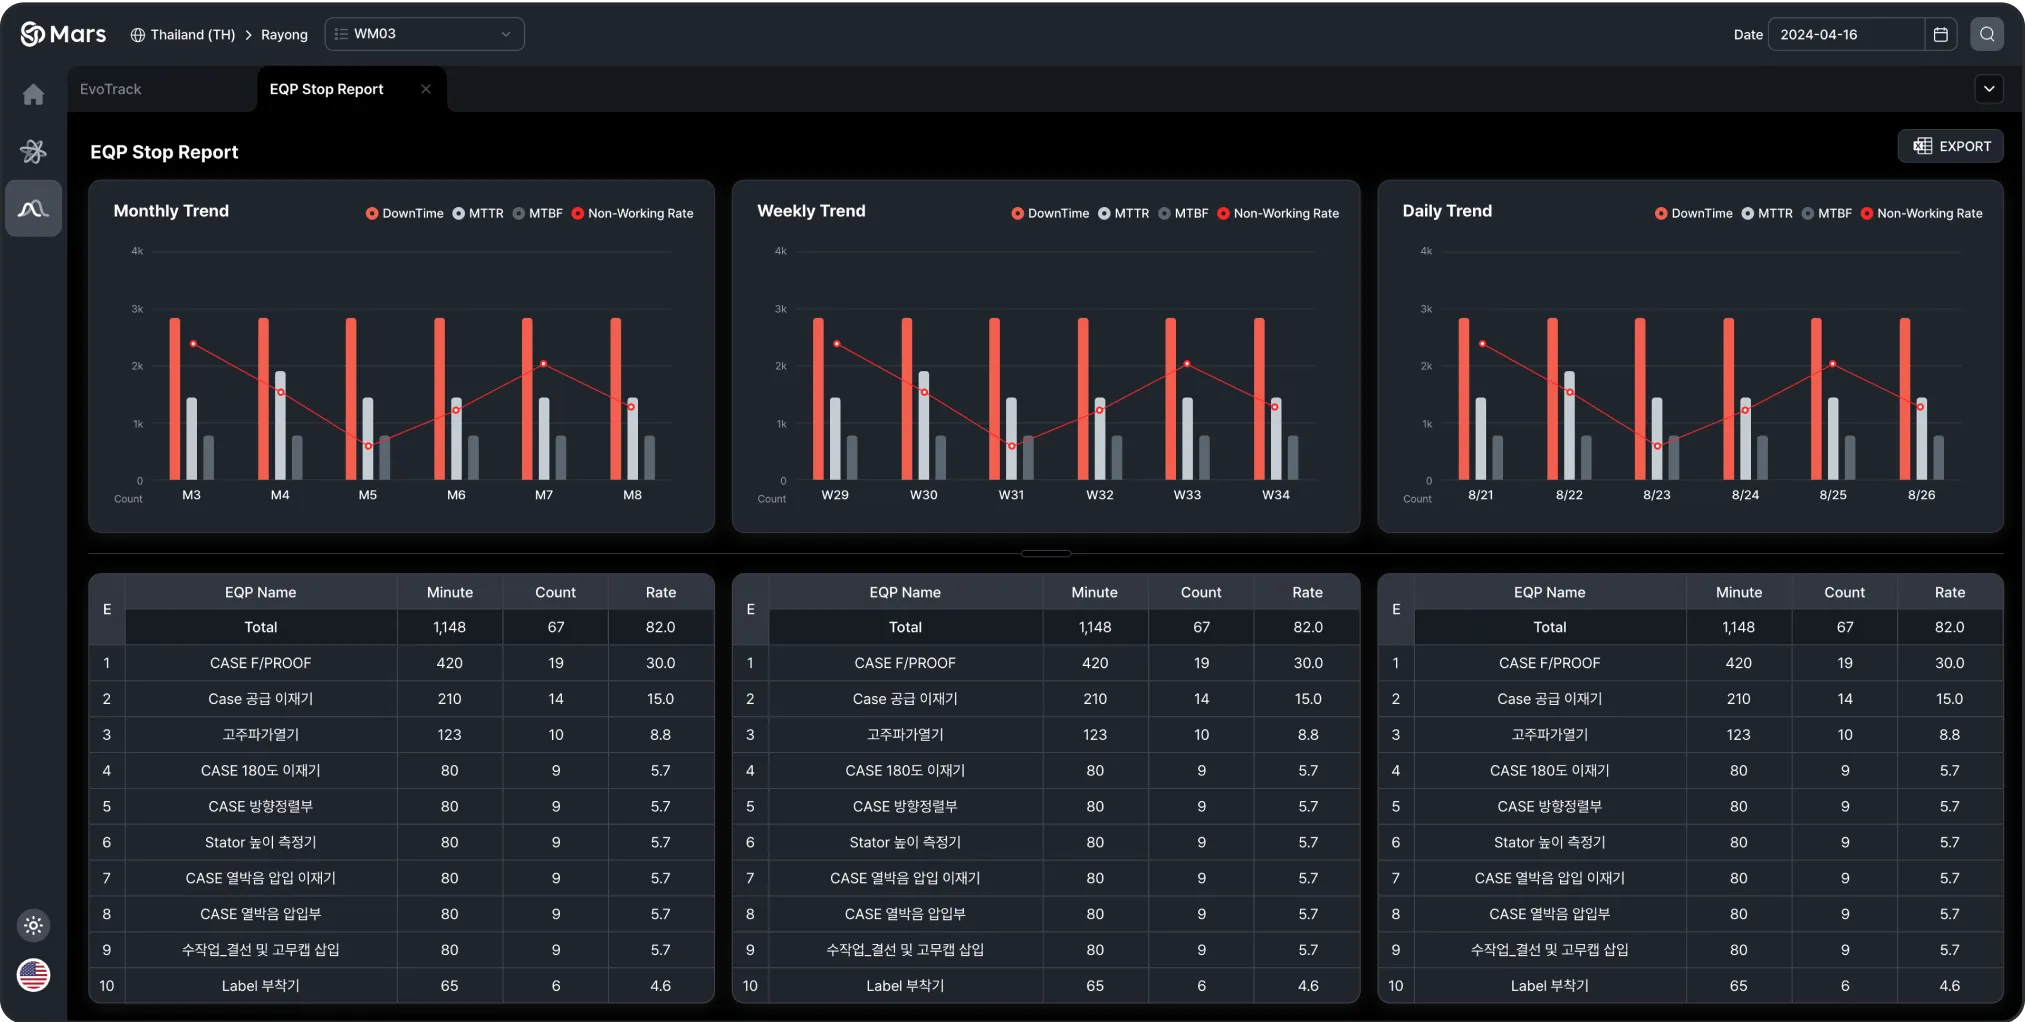
Equipment Productivity Report
It analyzes monthly, weekly, and daily trends to provide a comprehensive overview of the productivity and downtime for each piece of equipment.
Trend Graphs
The graphs show equipment productivity, idle time, downtime, Mean Time to Repair (MTTR), and Mean Time Between Failures (MTBF) across monthly, weekly, and daily intervals. This allows for a comparison of equipment performance over specific periods.
Worst 10 Equipment
A table lists the equipment with the longest downtime or lowest efficiency. It displays the total downtime, number of stops, and utilization rate for each piece of equipment, helping to identify the most inefficient equipment.
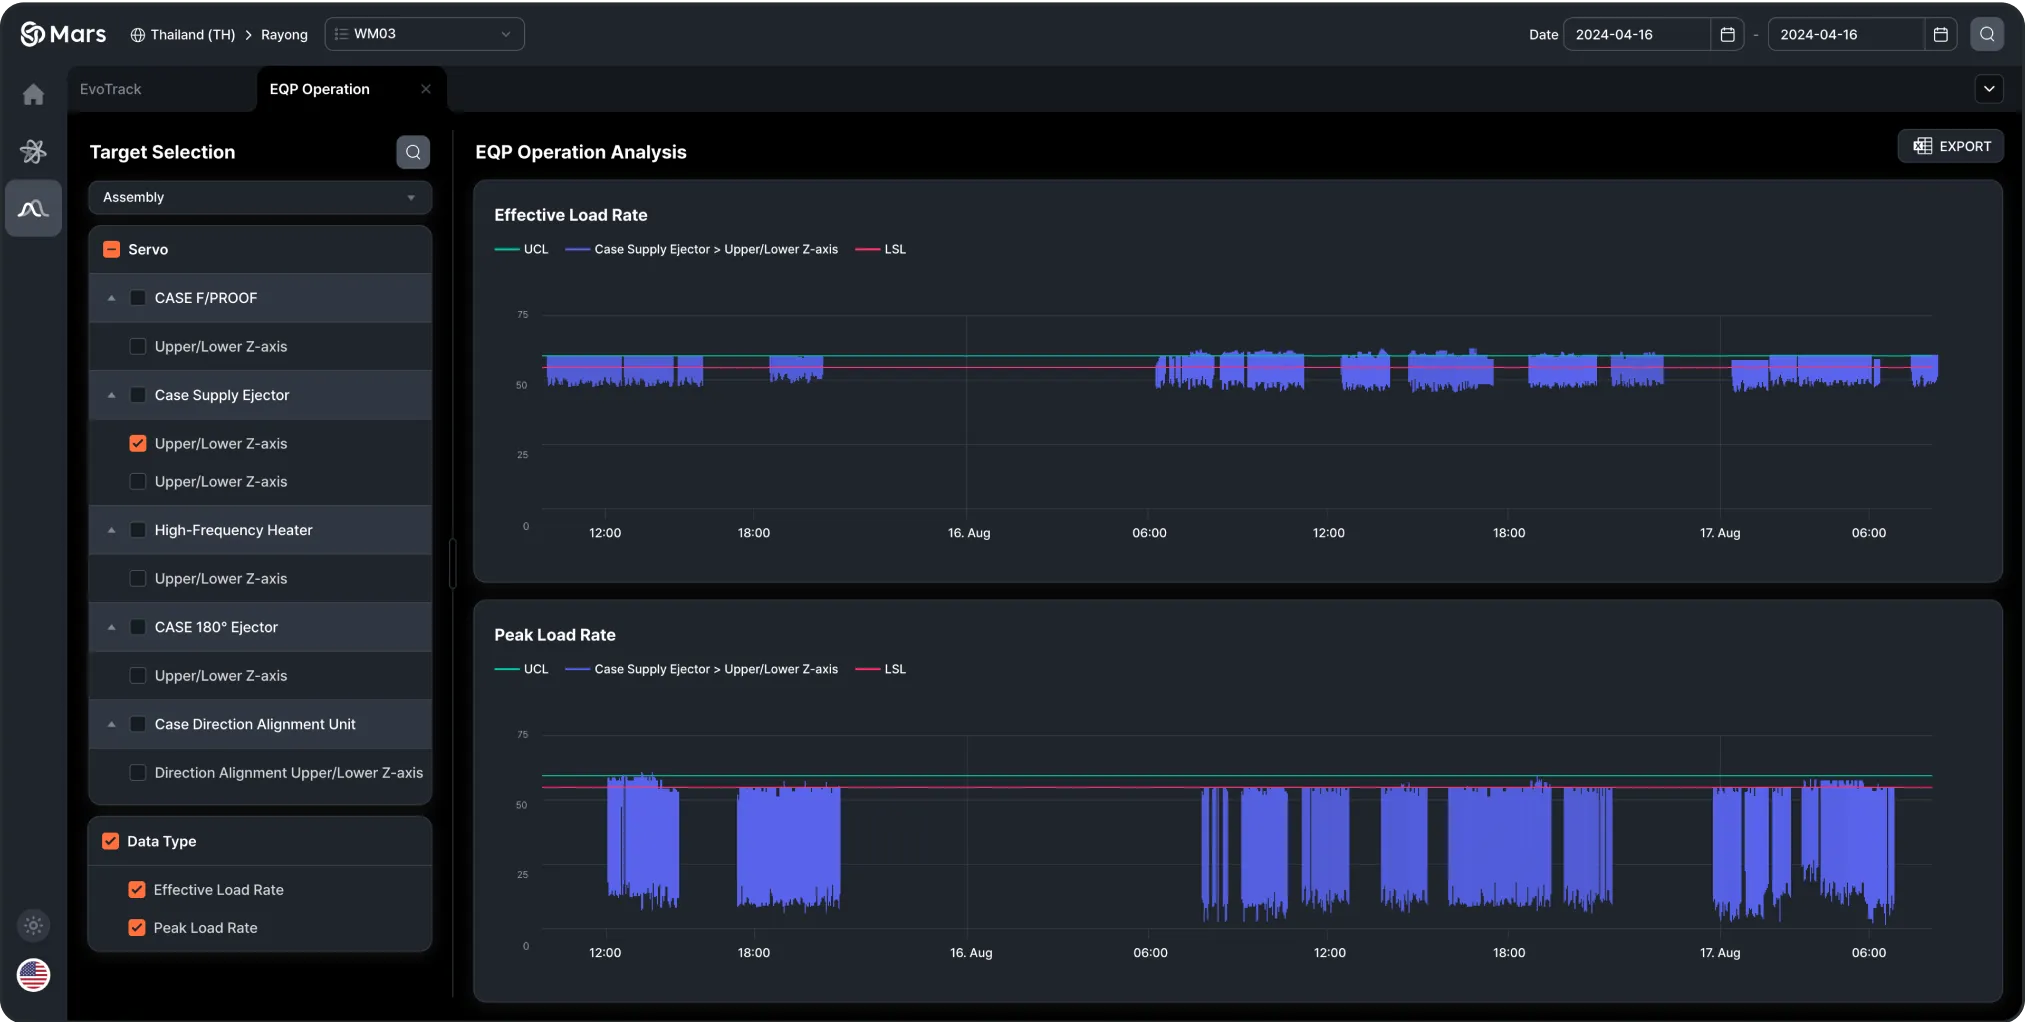
Equipment Unit (Motor, Cylinder, etc.) Operation Analysis
It analyzes the operational status and load rates of each equipment unit, with graphs to quickly identify abnormal points.
Unit Selection
Select equipment units (motors, cylinders, etc.) to analyze using checkboxes
Effective Load and Peak Load Graphs
Visualize unit load rates over time to quickly spot abnormal loads based on UCL and LSL.
Anomaly Detection
Identify abnormal equipment behavior to prevent potential failures or overloads.
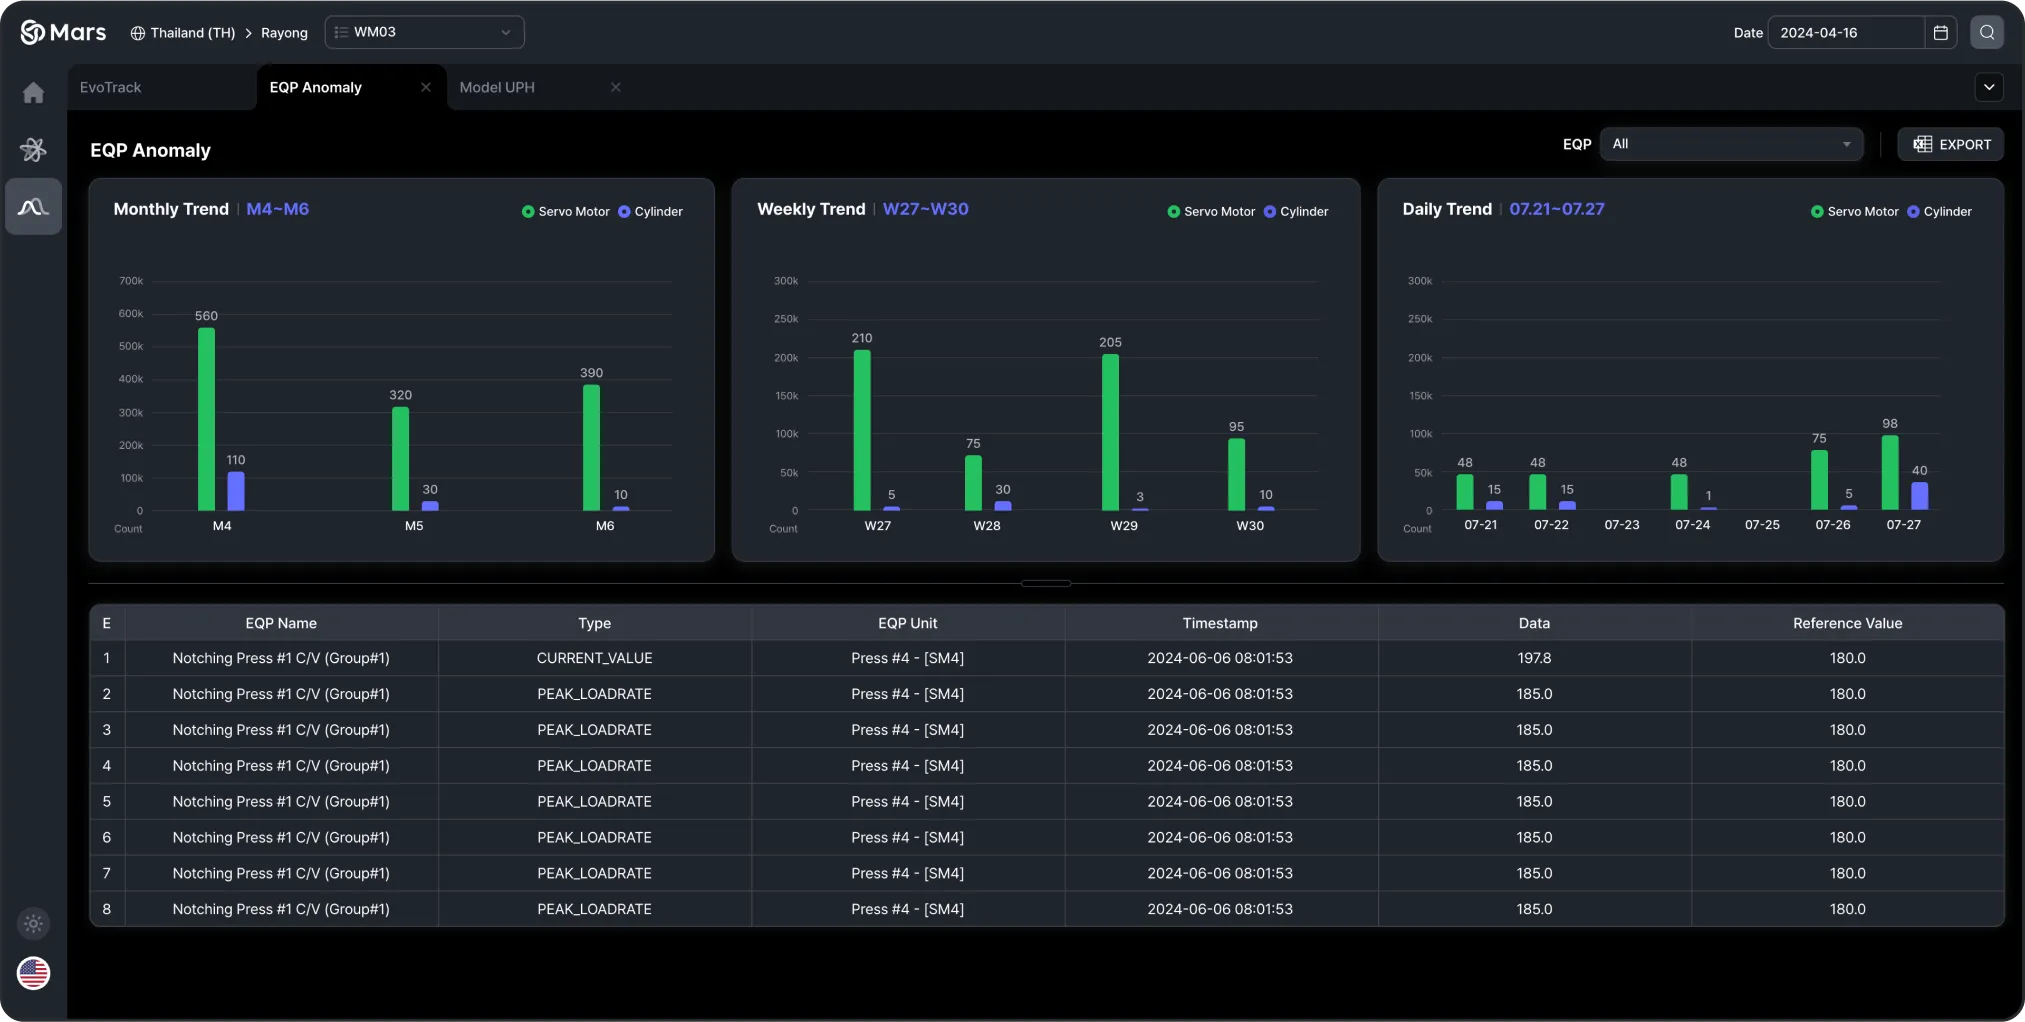
Equipment Anomaly Detection Alerts
It analyzes anomaly detection data across monthly, weekly, and daily trends, providing detailed alerts for each piece of equipment.
Trend Graphs
The graphs show anomaly detection occurrences divided by month, week, and day. They visually compare the frequency of anomalies detected in equipment related to servo motors, cylinders, and fastening systems.
Anomaly Alerts Table
This table provides specific information about each detected anomaly, including equipment name, equipment unit, detection date, and data. It also includes links to view more details about each alert.